Understanding Your Cumulative Profit Graph
Written By Oscar
Last updated 7 days ago
This article explains how to use the Cumulative Profit graph on your dashboard. This dynamic visual tool helps you track your total realized profits over time, providing a clear picture of your trading performance.
What the Cumulative Profit Graph Shows You
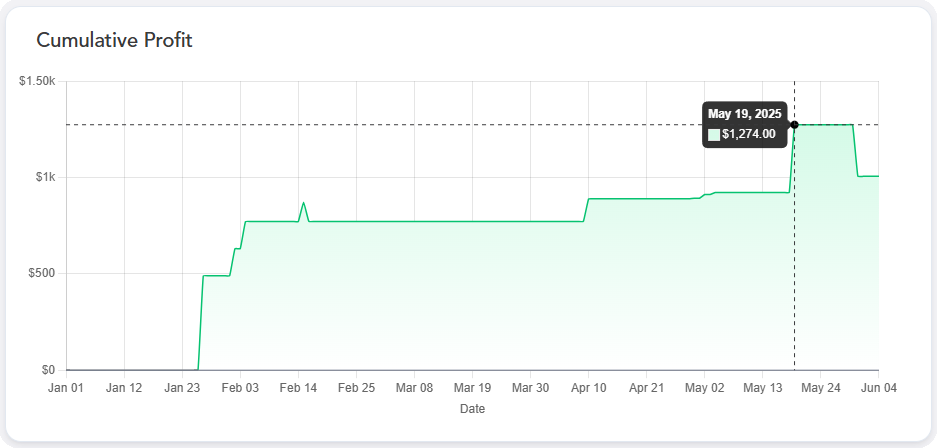
The Cumulative Profit graph displays the dynamic cumulative sum of your Total Realized Returns over time. Each point on the graph represents the total profit (or loss) from all trades closed up to that specific date. This calculation is based on the close date of each trade.
Dynamic Data and Automatic Updates
The data for your Cumulative Profit graph is pulled from our backend system and automatically updates whenever a new trade is closed. This means your graph always reflects your latest realized performance without you needing to refresh anything manually.
Additionally, the data displayed on the Cumulative Profit graph is directly tied to the Date Range Selector on your dashboard.
To view the Cumulative Profit for a specific date range:
Locate the Date Range Selector on your dashboard.
Select your desired date range using the predefined options or the calendar (refer to the Filtering Data by Date Range for detailed instructions).
The graph will dynamically update to show the Cumulative Profit specifically for that selected timeframe.
Visual Indicators: Green for Profit, Red for Loss
The graph uses intuitive color-coding to help you quickly understand your overall profitability:
Positive Cumulative Profit (Green): When your total cumulative profit is positive (above zero), the area of the graph will be filled in green. This indicates that your closed trades have, in total, generated a profit.
Negative Cumulative Profit (Red): When your total cumulative profit is negative (below zero), the area of the graph will be filled in red. This indicates that your closed trades have, in total, resulted in a loss.
This color change is dynamic and updates as your cumulative profit changes, giving you an immediate visual cue of your long-term performance.
Highlight
By utilizing the Cumulative Profit graph, you can gain a deeper understanding of your overall trading success and observe how your realized profits accumulate over time.
If you have any questions or encounter any issues, please contact our support team for assistance at support@orizonanalytics.io